Dutch bike usage rate analysis: How cycling is best
"The bicycle is not just a vehicle; it is a fundamental part of the rhythm of Dutch life."
In the Netherlands, cycling serves as a primary method of movement, accounting for a significant portion of daily travel. This analysis explores the Dutch bike usage rate analysis, examining how different demographics and locations contribute to these high numbers.
You will learn about national transport shares, urban modal splits, and the specific ownership statistics of Amsterdam.
How does the Dutch bike usage rate analysis compare to other transport modes?
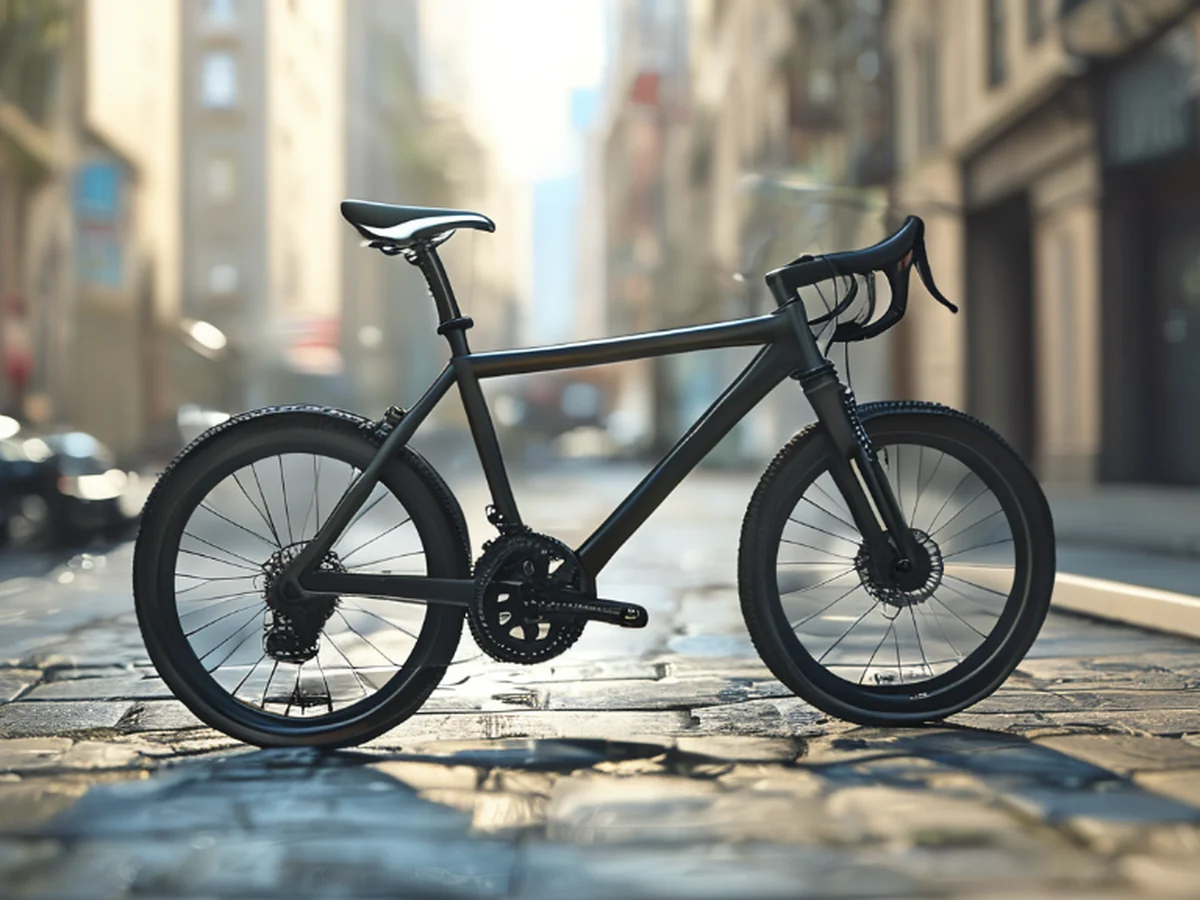
At dawn, a cyclist pedals through a quiet street, feeling the cool breeze while contemplating the Dutch bike usage rate analysis compared to the heavy cars passing by.
A cyclist pedals through a quiet residential street, feeling the breeze as they head toward the city center. In the Netherlands, cycling is the second-most common mode of transport, with 36% of Dutch people listing the bicycle as their most frequent way of getting around on a typical day.
This compares to 45% for cars and 11% for public transport.
Nationwide, cycling maintains a modal share of 27% of all trips, covering both urban and rural areas. While the car remains a dominant force, the bicycle provides a consistent alternative for a large portion of the population.
This high level of engagement demonstrates how deeply integrated cycling is into the national transit fabric.
What is the city transport mode share in major hubs like Amsterdam?
A commuter weaves through a crowded intersection in Amsterdam, where the presence of two wheels is more visible than any other vehicle. In cities, the share of bicycle trips is even higher than the national average. For example, Amsterdam shows a modal share of 38%, while Zwolle reaches 46%.
The Amsterdam cycling data reveals a high density of ownership and usage within the city limits.
According to the most recent figures published by Central Bureau of Statistics (CBS), in 2015 the 442,693 households (850,000 residents) in Amsterdam altogether owned 847,000 bicycles—or 1.91 bicycles per household.
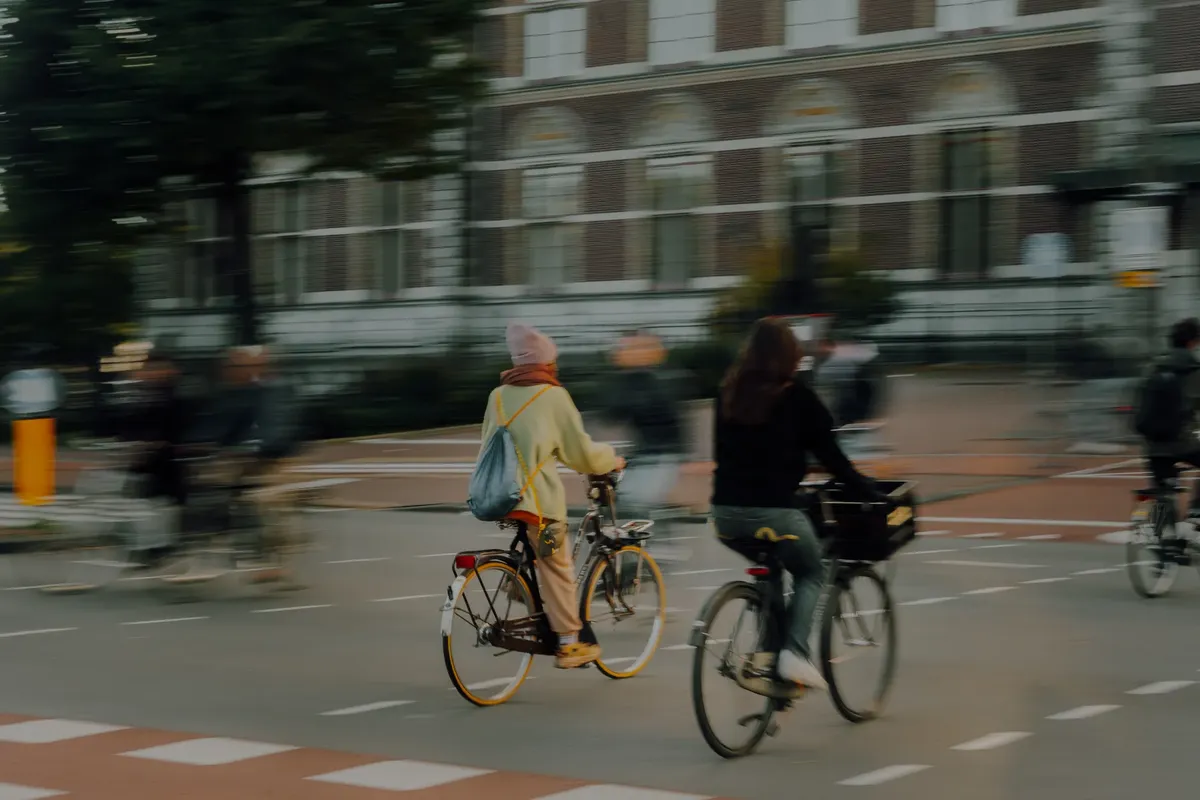
This density ensures that the bike is often the most practical choice for local transit.
How does bike infrastructure impact daily travel patterns?
An engineer maps out a new path, ensuring a seamless connection between residential zones and business districts. Effective planning has led to significant physical infrastructure, such as the 35,000 km of cycle-track that has been physically segregated from motor traffic.
This amount is equal to a quarter of the country's entire 140,000 km road network.
This specialized infrastructure is a key component of the Zolle bike infrastructure concept, providing safety and efficiency. By separating cyclists from motor vehicles, the country has created a reliable environment for daily commuting.
These paths allow for consistent movement regardless of the surrounding traffic density.
What are the demographic trends in cycling among students?
A student pulls their bike into a rack at a secondary school, preparing for a day of classes. Cycling is a vital part of the daily routine for the younger generation, with 75% of secondary school students cycling to school.
This number rises to 84% for those living within 5 km (3 miles) of their school.
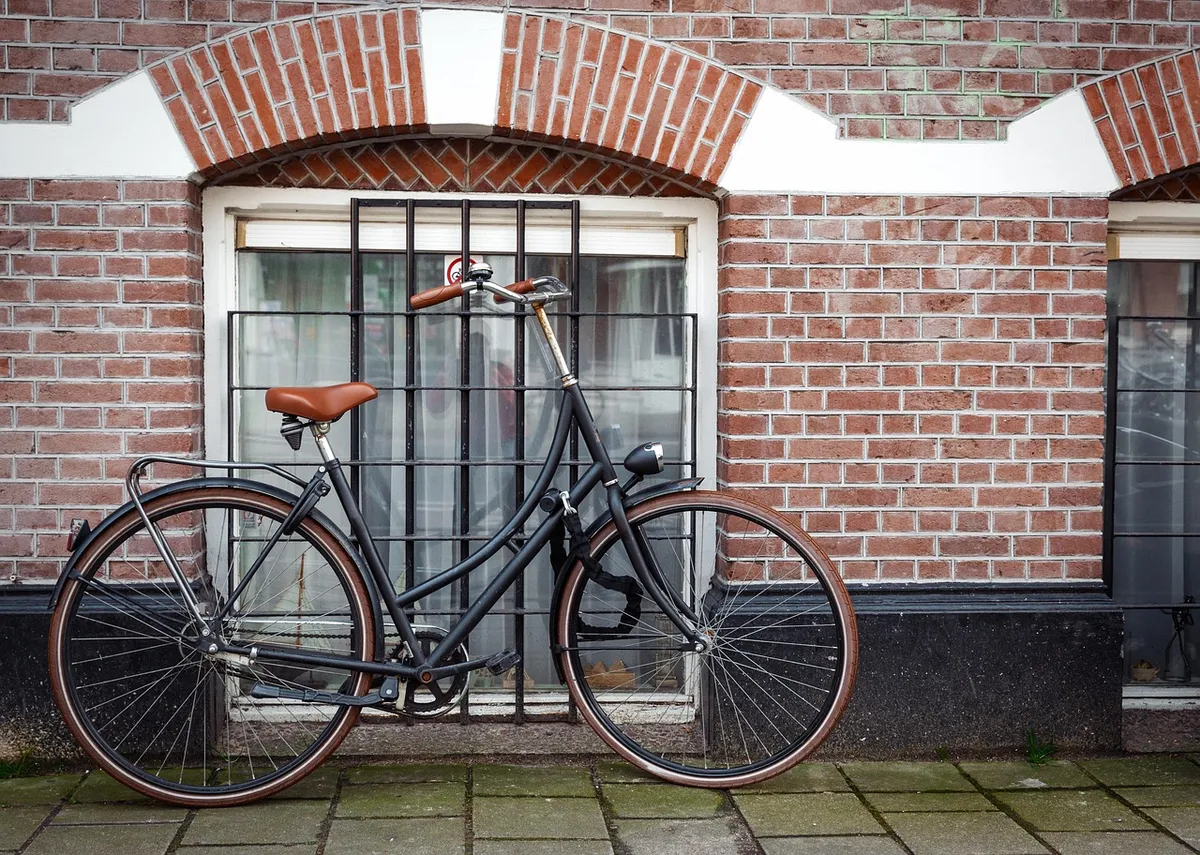
Even for longer distances of 16 km (10 mi) or over, some 8% of secondary school children cycle in each direction to school. This is mainly seen in rural areas where the closest secondary schools can be a fair distance away. These patterns show that the habit of cycling is established early in life.
What are the safety and health implications of high cycling rates?
A person pauses to catch their breath after a vigorous ride, feeling the physical benefits of the journey. The WHO's 2009 report suggests that increasing physical activity is a public health "best buy", and that cycling is a "highly suitable activity" for this purpose.
The health benefits of such activity correspond to more than 3% of the Dutch gross domestic product.
However, safety remains a critical consideration for all riders. In 2015, cycling deaths made up 30% of road deaths in the Netherlands, representing 185 out of 621 deaths.
Research in 2013 showed that 60% of fatal cycling accidents took place at junctions, and in two out of five of those accidents, cyclists were not given priority by the driver.
How can one maintain a consistent cycling routine?
A rider checks their tire pressure and adjusts their seat before setting off on a morning ride. To maintain a regular routine, one can follow these steps:
- Regular maintenance of the bicycle to ensure mechanical reliability. 2. Planning routes that utilize existing segregated cycle-tracks for safety. 3. Integrating cycling into daily schedules to build consistent physical activity.
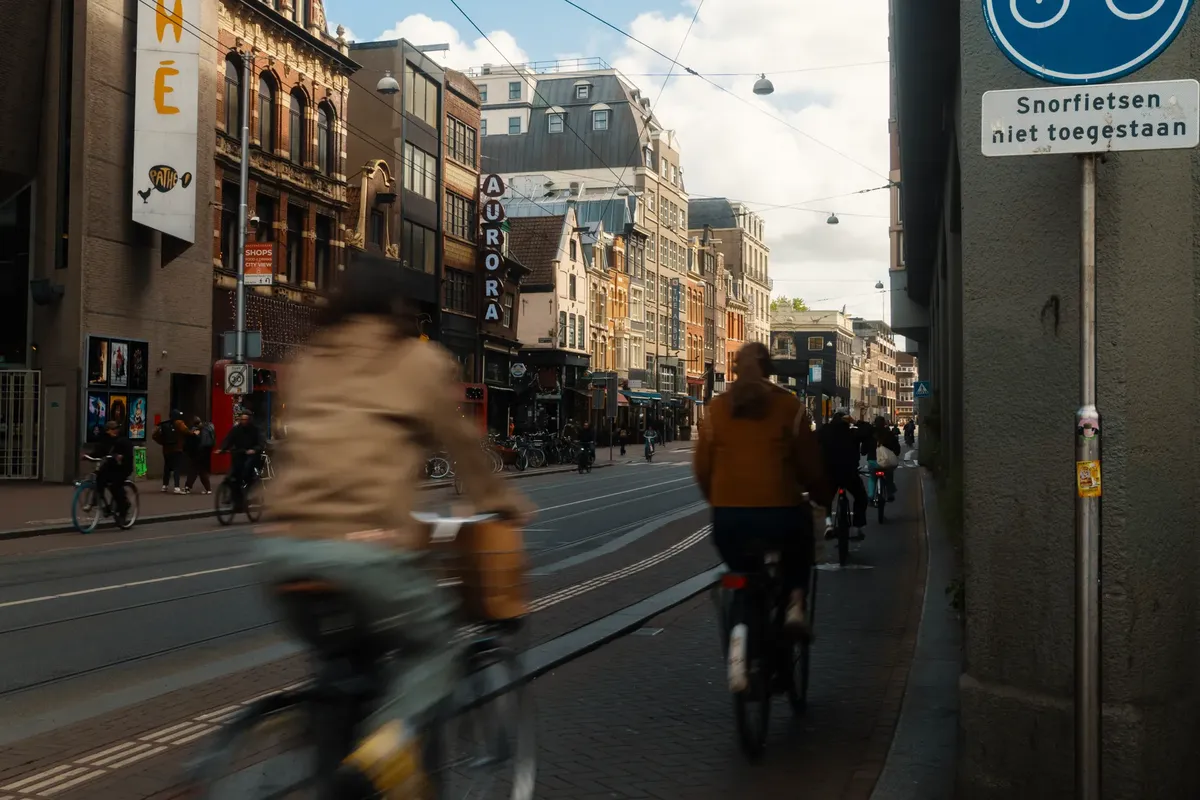
A final check of the bike's components ensures a smooth and safe ride every time. I find that checking my tire pressure and chain tension before a long ride makes the difference between a pleasant trip and a breakdown.
| Category | Statistic |
|---|---|
| National Trip Share | 27% |
| Amsterdam Modal Share | 38% |
- How does the Dutch bike usage rate analysis compare to other transport modes?
- What is the city transport mode share in major hubs like Amsterdam?
- How does bike infrastructure impact daily travel patterns?
The same subject is also called Bike share in Netherlands.
This part also covers Bike usage by city in NL.
This part also covers Cycling share urban transport.
Related
- Swiss military bike history: 57 cm Guide to frame design
- How did the initial proposal lead to the first rides?
Safety and Usage Conditions
The bicycle, while a healthy vehicle, faces specific safety conditions that require caution. In 2015, cycling deaths constituted 30% of all road deaths in the Netherlands. This statistic represents 185 out of 621 total deaths. Research conducted in 2013 indicated that 60% of fatal cycling accidents occurred specifically at junctions. Furthermore, in two out of five of those fatal accidents, the driver failed to grant the cyclist priority.
Infrastructure and Travel Conditions
The bicycle benefits from specialized infrastructure that sets it apart from other vehicles. The country utilizes 35,000 km of cycle-track which is physically segregated from motor traffic. This specialized infrastructure accounts for a quarter of the nation's entire 140,000 km road network. This segregation creates a reliable environment for the bicycle, allowing for consistent movement regardless of the surrounding traffic density.
Demographic Conditions for Cycling
The bicycle's role as a vehicle changes depending on the distance traveled by the rider. For students, the usage rate is 84% when the school is within 5 km. Even when the distance increases to 16 km or more, some 8% of secondary school children still choose the bicycle in each direction. This pattern suggests that the habit of cycling is established early, regardless of the distance.






Comments 0